
Help
Here’s a step-by-step guide to help get you started using Keeping Track Online.
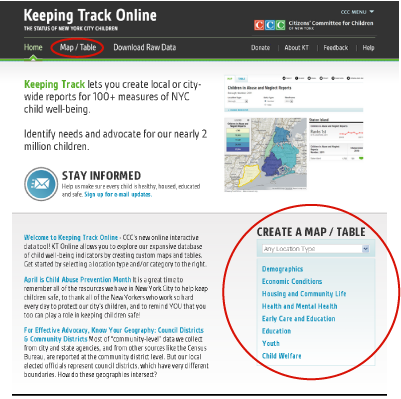
1. Get started.
You can start by selecting a location type from the drop-down menu or data category from the list below the CREATE A MAP/TABLE header in the bottom right corner. Or you can click on the Map/Table link in the navigation bar.
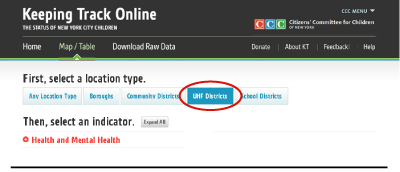
2. Select a location type.
The default for this selection is “Any Location Type” which will allow you to browse all of the indicators that we have for all location types. This is the easiest way to start exploring our data.
But if you are interested in data by a particular geography, such as data by United Health Fund Districts (UHF Districts), make your selection and the list of data will be adjusted to only show what is available for that geography.
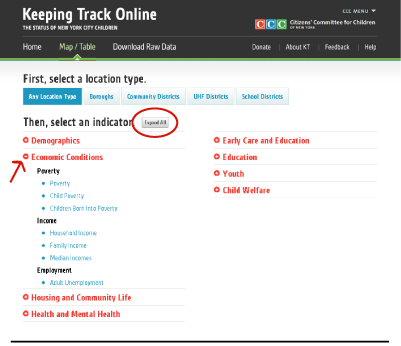
3. Select an indicator.
The plus sign next to the indicator category allows you to expand that category. The Expand All button will expand all the categories. Clicking an indicator will take you directly to a map view of that indicator.
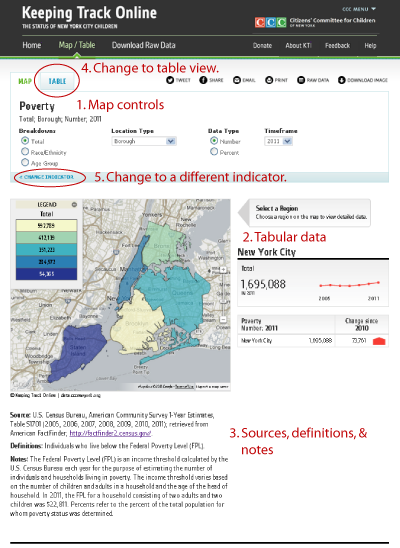
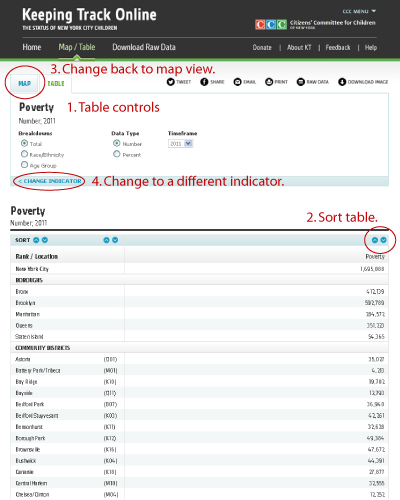
4. Explore your map.
There are several controls at the top of your map page that allow you to change the way you view your data. You can view different breakdowns (i.e. Race/Ethnicity, Age Group), location types (i.e. Boroughs, Community Districts; although these vary by indicator and not all indicators are available in all location types), data types (i.e. Number, Percent, Rate), and years. Scroll over the map to see data points, and click a location to see data and trends for that location to the right of your map. Check the sources, definitions, and notes below the map for more information about the data you’re viewing.
You can click on the TABLE tab above the map controls to view the indicator in a table form.
You can choose another indicator to explore by clicking the < CHANGE INDICATOR link below the map controls.
5. Explore your table.
The table view has similar controls to the map view at the top of the page. The arrows at the top of each column allow you to sort the data. You can change back to the map view at any time by clicking the MAP tab, or change indicators by clicking the < CHANGE INDICATOR link.
6. Share your data!
Use the icons at the top of the map or table view to share your data via Facebook, Twitter, or Email. You can also print, download a CSV of the raw data, or download a JPEG image.

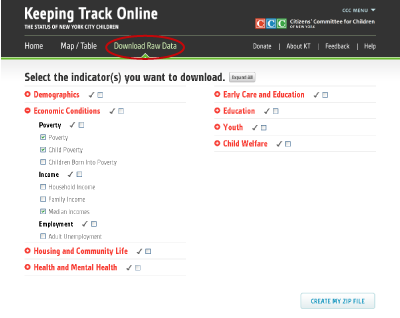
7. Download raw data.
KT Online also has an easy way to download multiple indicators – just click the Download Raw Data link in the navigation bar.
8. Contact us.
We have tried to make using Keeping Track Online as easy and intuitive as possible. But if you find yourself stuck or can’t find what you’re looking for, feel free to contact us. Email faraiza@cccnewyork.org with questions.